Find out if your strategy works, before it costs you
Replay real market history candle by candle, trade it with realistic spreads and stops, and see your true win rate. All without risking a naira.
No card and no sign-up needed to start.
Replay
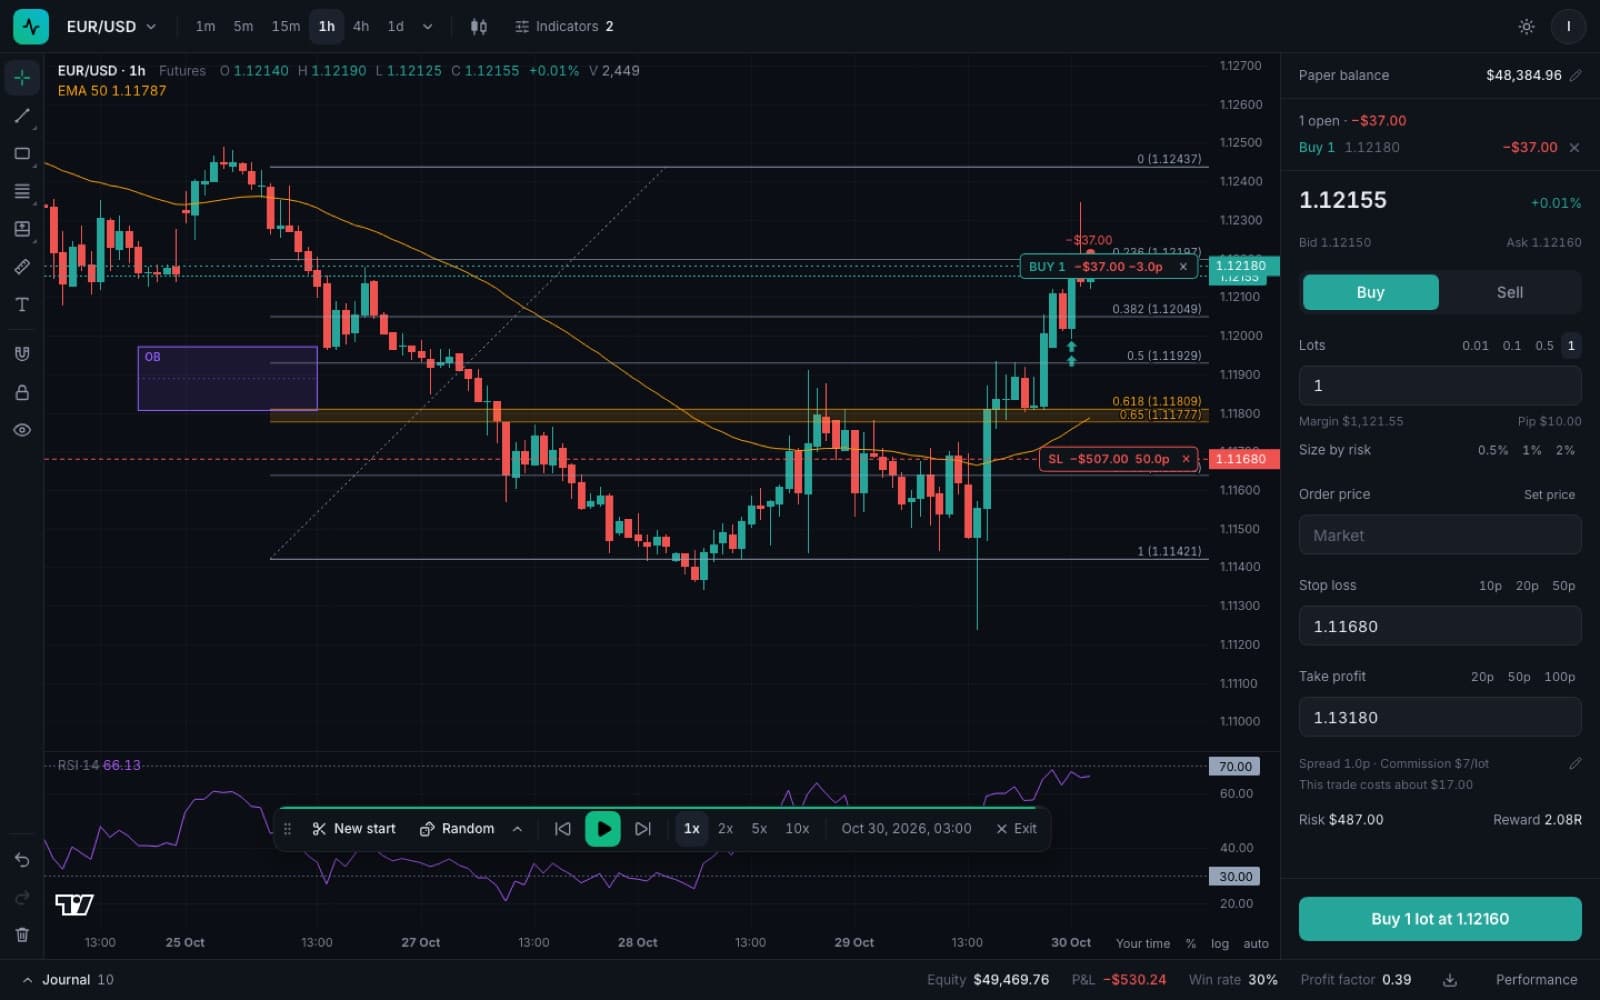
Trade the past as if it's happening now
Everything after your starting candle stays hidden. Step one bar at a time or play at up to 10x, and decide with only what you could have known.
- Pick any candle to start from
- Go straight to a date
- Your replay survives a refresh
Random replay
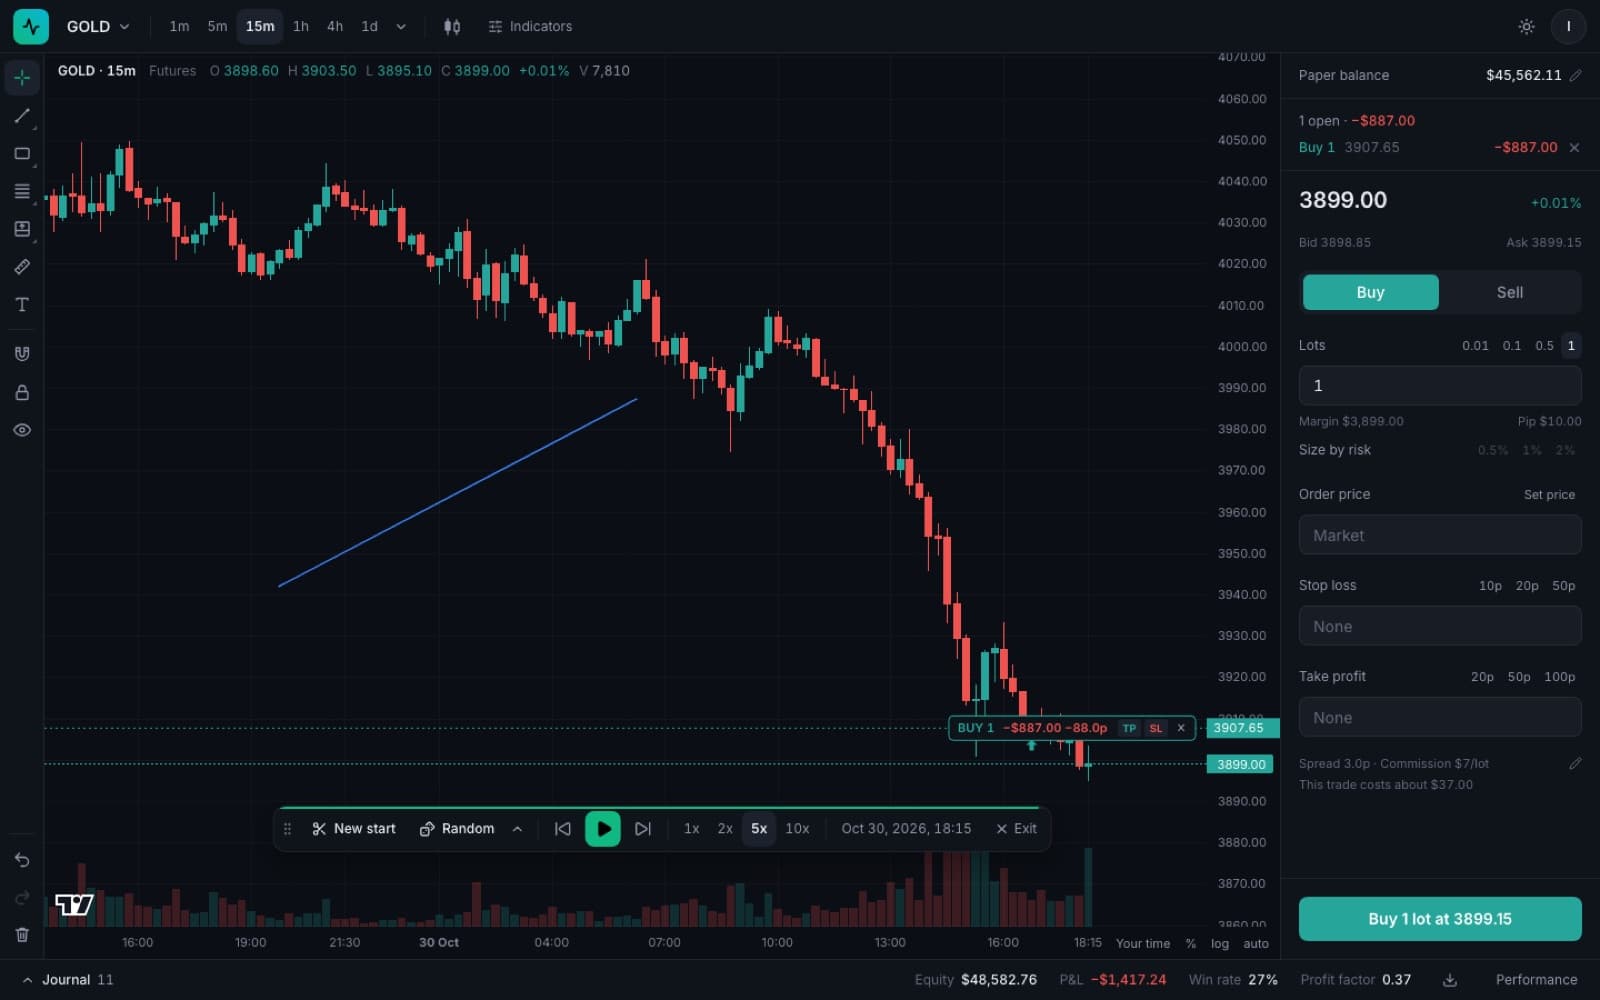
Practise without knowing what's coming
One click drops you somewhere random in a market's history. Turn dates off too, and you can't lean on your memory of how that week played out.
- Lands anywhere in the available history
- Hide dates for blind practice
- Start again as many times as you like
Realistic fills
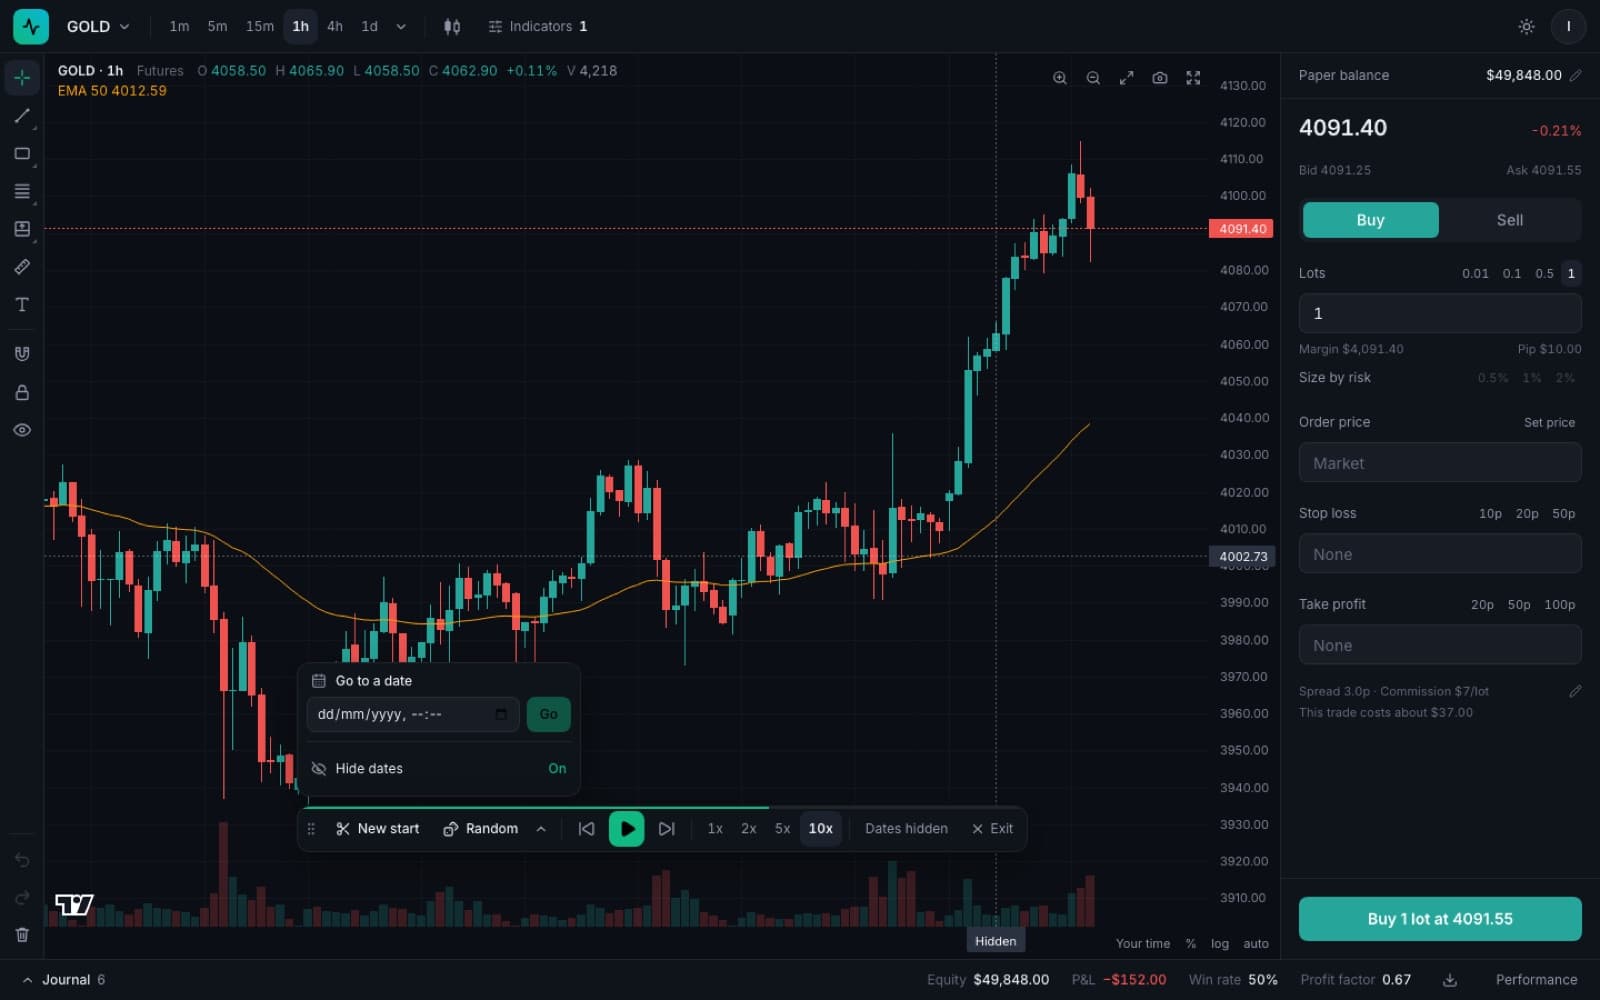
Results closer to what you'd really get
Most practice tools fill you at a perfect price, which flatters every strategy. Here you pay the spread and commission, and a stop that gets gapped through fills at the worse price.
- Bid and ask, with costs you can set to match your broker
- Stops and targets fill through gaps
- Shorter candles decide which was hit first
Performance
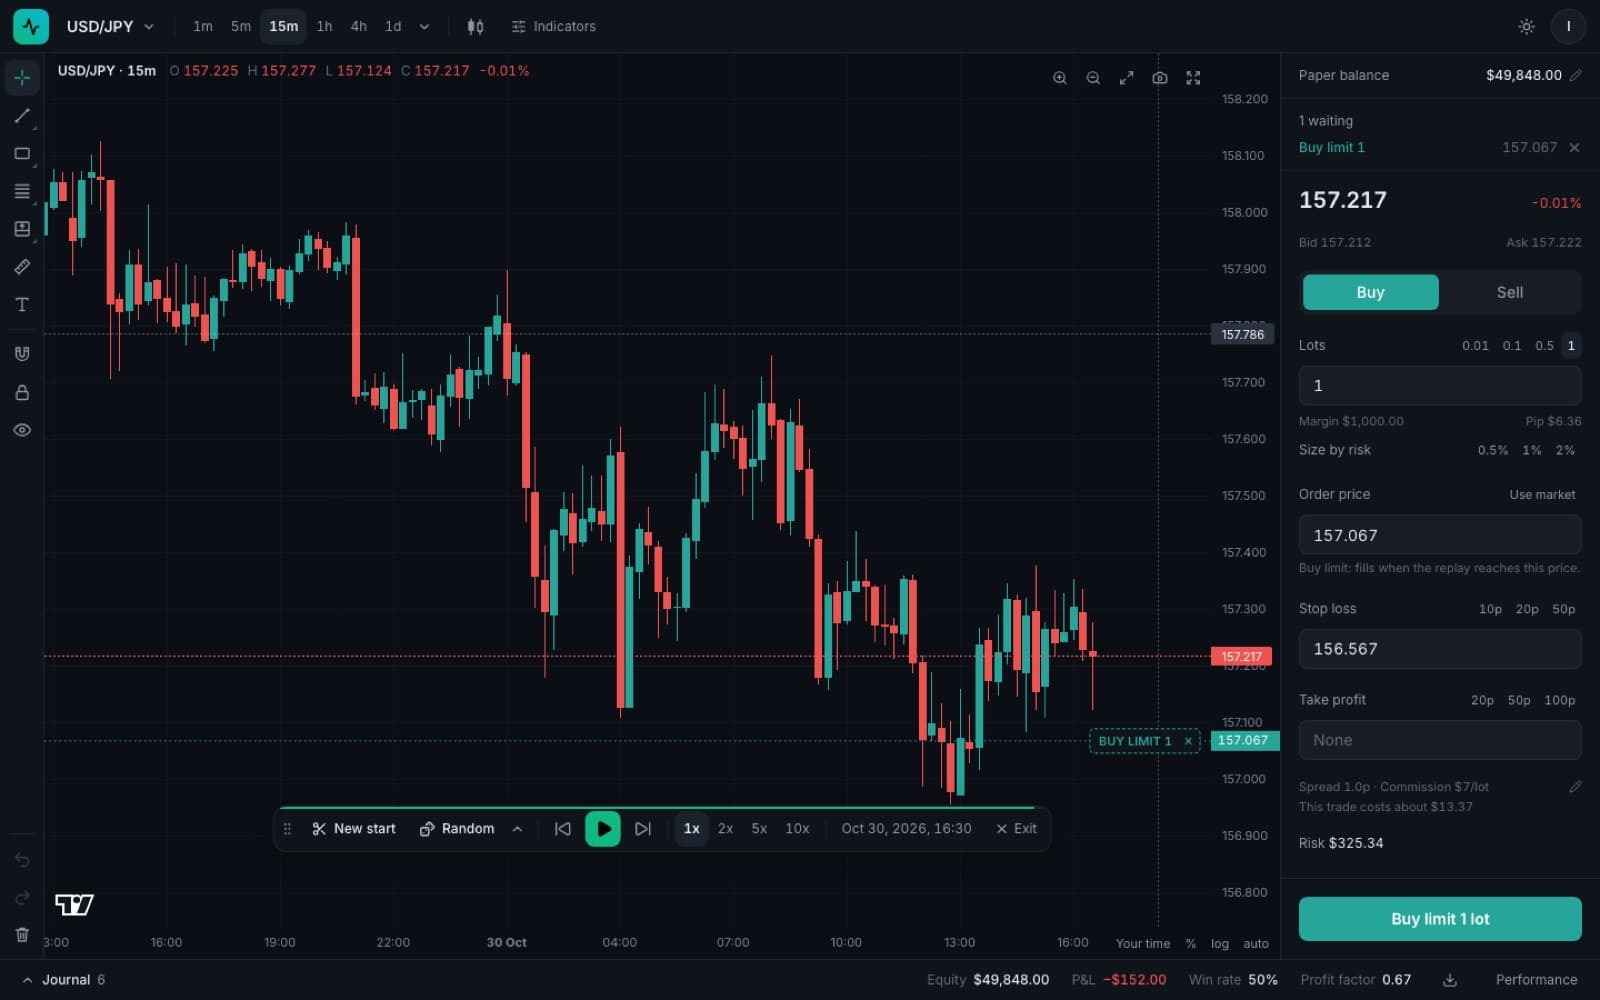
Know whether your strategy actually works
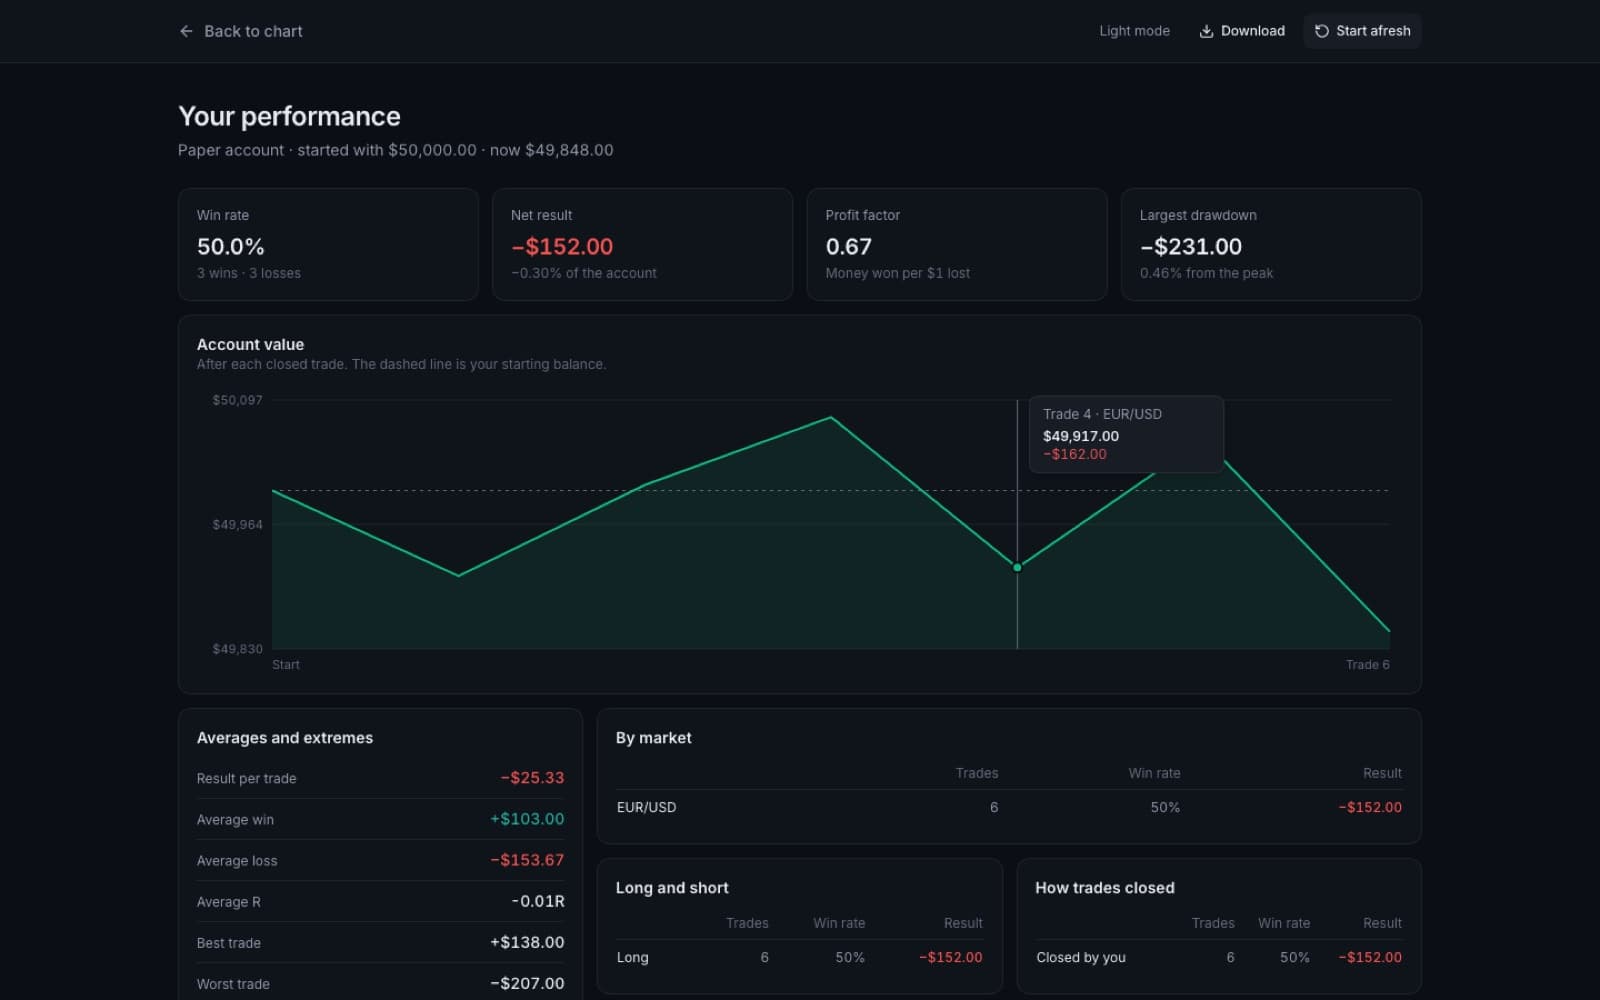
Every trade goes in your journal. See your win rate, profit factor and largest drawdown, then jump back to any trade on the chart to study it.
- Account value after every trade
- Results by market, session and weekday
- Notes on trades, and start afresh whenever you like
Everything else you'd expect from a proper chart
Drawing tools
Trend lines, rays, channels, zones, Fibonacci retracement and extension, position boxes, a ruler and notes.
Order types
Market, limit and stop orders with stops and targets you can drag on the chart, plus a one-click move to breakeven.
Size by risk
Choose 0.5%, 1% or 2% of your balance and the lot size works itself out from your stop.
Indicators
Moving averages, Bollinger Bands, RSI and MACD, in their own panes.
Chart types
Candles, hollow candles, Heikin Ashi, bars, line and area, with log and percent scales.
Every timeframe
From 1 minute to monthly. Switch mid-replay and the candle shows only what's formed so far.
Nothing gets lost
Drawings, trades, your replay position and your chart view are all still there when you come back.
Keyboard first
Shortcuts for every tool and for playback, so your eyes stay on the chart.
70 markets in one place
Practise on what you actually trade.
34
Forex
EUR/USD, GBP/JPY, USD/ZAR and more
3
Metals and oil
Gold, silver, WTI crude
12
Crypto
BTC, ETH, SOL, BNB and more
7
Stocks
NVDA, AAPL, TSLA, SPY and more
14
Synthetics
Volatility, Boom, Crash, Step
Start free. Upgrade when you need more.
| Feature | Free ₦0 | Pro ₦2,500 for 30 days |
|---|---|---|
| Markets | 4 forex pairs | All 70 |
| Timeframes | 15m, 1h, 4h, daily | All, 1m to monthly |
| History | Most recent 1,000 candles | All available |
| Replay and paper trading | ||
| Realistic spread and commission | ||
| Stops, targets and position boxes | ||
| Trade journal and win rate | ||
| Drawings per market | 10 | Unlimited |
| Moving averages | ||
| Bollinger Bands, RSI and MACD | ||
| Random replay | ||
| Go to a date and hide dates | ||
| Limit and stop orders | ||
| Results by session and weekday | ||
| Download your trades |
Pro is one payment for 30 days and doesn't renew by itself.